Market & Macroeconomic Outlook 1Q2024
This analysis examines macroeconomic forces that shaped the US market in the first quarter of 2024. This Market Outlook 1Q2024 explores key economic indicators to understand the overall health of the economy during this period.
Economic Overview
SOFR Forward Curve
The 1-month SOFR forward curve reveals a dynamic shift in market expectations for interest rates. The upward slope indicates an anticipation of rising SOFR rates, particularly in the near term (March-June 2024) compared to previous flatter trajectories. This might reflect concerns about persistent inflationary pressures. If market participants believe inflation remains above desired levels, they may expect the Federal Reserve to continue tightening monetary policy, holding “higher for longer”.

Source: Chatam Financial
GDP
The US economy grew at an annual rate of 3.2% in the fourth quarter of 2023, down slightly from the 4.9% growth observed in the third quarter. The increase in real GDP was driven by growth in consumer spending, exports, government spending (both state and federal), and investment in nonresidential fixed assets (e.g., factories, offices). Private inventory investment decreased in Q4, partially offsetting the positive contributions from other sectors. The previously reported growth rate for Q4 was 3.3%, which has been revised down slightly to 3.2%.
This report suggests the US economy continued to expand in Q4 2023, although at a slower pace compared to Q3. Consumer spending remains a key driver of growth.

Source: US Bureau of Economic Analysis
Soft Landing In 2024?
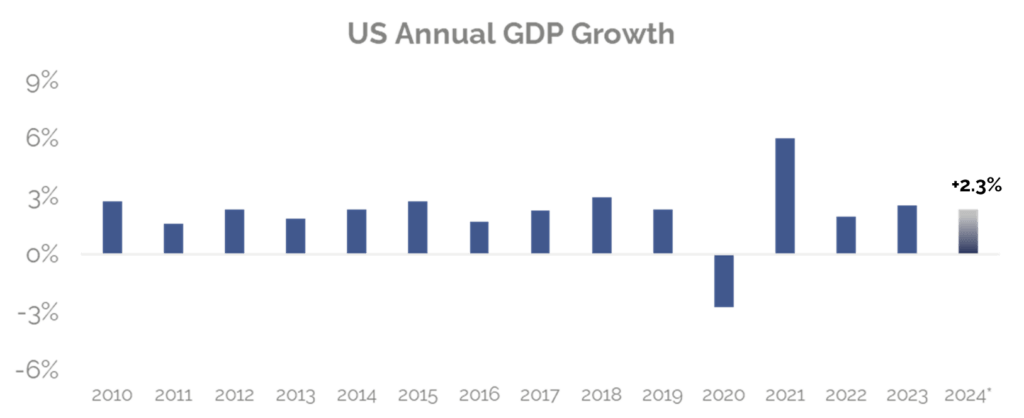
Economists like UBS, Morgan Stanley, JP Morgan Chase, Goldman Sachs, between others, are predicting moderate US GDP growth in 2024, with forecasts ranging from a slight decline to nearly 3%. This follows a trend of stronger growth in recent years. The consensus forecast sits around 2.3%, and factors like consumer spending and interest rate adjustments will influence the final outcome.
Overall, the economists’ forecasts suggest a moderate GDP growth for the US in 2024 compared to recent years. This could be a sign of a soft landing for the US economy, where inflation subsides without triggering a recession.

Source: US Bureau of Economic Analysis, WorldBank
Core CPI
The latest US core CPI data, shows a year-over-year increase of 3.8%. This marks a slight decrease from the previous month’s reading of 3.9%, offering a hint of potential moderation in inflationary pressures. However, it’s important to consider several factors:
- Still Above Target: Core CPI remains well above the Federal Reserve’s long-term target of 2%. This sustained inflation could lead the Fed to continue tightening monetary policy.
- Month-over-Month Changes: While the year-over-year comparison shows some moderation, a closer look at month-over-month changes is necessary. Analyzing the most recent month’s core CPI compared to the previous month can reveal the current inflationary trend.

Source: US Bureau of Labor Statistics
Unemployment
February’s unemployment rate of 3.9% represents a 0.2% increase compared to January’s 3.7%. This uptick snaps a 3-month of steady or declining streak (Dec. 2023 – Feb. 2024) and warrants closer examination.
While it remains near historic lows, the increase could signal a turning point in the labor market. There are two main possibilities:
- Normal Fluctuation: The labor market is dynamic, and slight monthly ups and downs are not uncommon.
- Shifting Landscape: An increase in labor force participation could contribute to a higher unemployment rate, even if job creation remains steady. This could indicate a change in the economic environment or worker behavior.

Source: US Bureau of Labor Statistics
By understanding this key factors in the market outlook 1Q24, investors can make more informed decisions about where to allocate their capital. Examining both the big picture and the granular details of industry performance paints a comprehensive portrait of the market landscape, allowing for a more nuanced investment strategy.
